|
|
||
|---|---|---|
| .. | ||
| dist | ||
| .travis.yml | ||
| LICENSE.md | ||
| README.md | ||
| browser.js | ||
| example.js | ||
| index.js | ||
| output.PNG | ||
| package.json | ||
| test.js | ||
README.md
Diagnostics
Diagnostics is a small debugging library which allows you to output your debug logs by setting an environment variable. The library works for server-side and client-size applications so it's great for writing isomorphic JavaScript.
The debug output can be triggered using environment variables on the server and using localStorage, hashtags and window.name on the browser. If the debug output is not enabled this module will result in an empty function causing the JavaScript compiler engines to remove it completely from your code so there is absolutely no performance overhead or excuses left to not use logging in your code!
Installation
The module is released in the public npm registry and can easily be installed by running.
npm install --save diagnostics
For client-side/front-end facing application we assume that you're using
browserify as your build tool as the client code is bundled as the
browser.js file in the root of this repository.
Usage
When you require the module it returns a function that expect a name or prefix for the debug messages. This prefix is what you use to enable specific debug messages.
The exported function of the module accepts 2 arguments:
nameThe namespace of the debug logger.optionsThese options can only be applied to the server, not client code:
colors: Enable or disable colors. Defaults to true if your stdout is a tty.stream: The stream instance we should write our logs to. We default toprocess.stdout(unless you change the default using the.tomethod).
var debug = require('diagnostics')('foo');
debug('hello world %d', 12);
In the example above you can see that we've created a new diagnostics function
called debug. It's name is set to foo. So when we run this in Node.js using:
node index.js
We will see nothing in the console as the log messages are disabled by default.
But when set the DEBUG or DIAGNOSTICS environment variables to the name of
the debug function it will show up:
DIAGNOSTICS=foo node index.js

hello world 12
You can enable or disable specific diagnostic instances in the ENV variables by separating them using a space or comma:
DEBUG=foo,-bar,primus:*
In the example above you also see an example of a wild card *. This ensures
that anything after it or before it will be allowed.
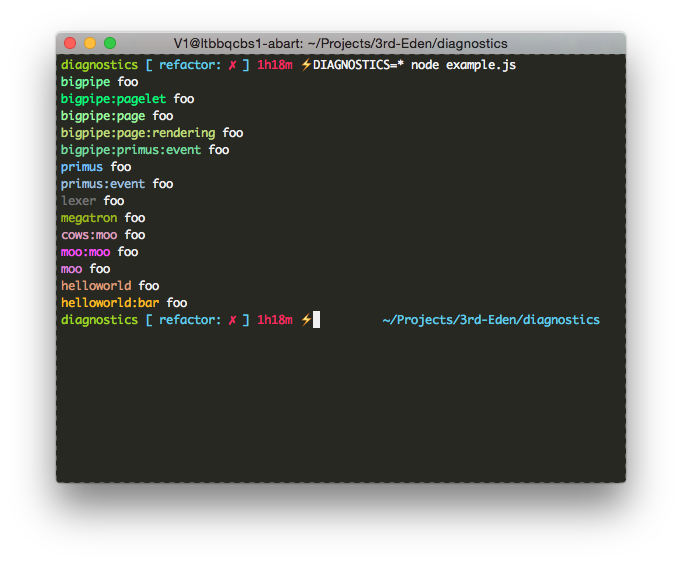
To make it easier to see where the log messages are coming from they are colored automatically based on the namespace you provide them. The deeper the namespace, the lighter name will be toned as seen in the following output.
Browser
The usage for browser is exactly the same as for node. You require the
diagnostics method and supply it with a name argument. The big difference is
that no longer can use environment variables as these only work on the server.
So to go around that you can use:
- hashtag The hashtag will be parsed using query string decoding. So if you
have an hash
#debug=fooit will trigger allfoolines to be dumped to your browser console. - localStorage We will search for a query string in either the
envordebugkey oflocalStorage. We again assume that the value has query string encode value which contains eitherdebugordiagnostics.localStorage.env = 'diagnostics=foo'. - window.name As
localStorageis not available in all browsers, we provide a fallback towindow.namewhich can contain the same values as thelocalStorage's env/debug keys.
Unlike the server, the output of the browser is not colored. The reason for this that it would take a considerable amount of code. Which is not worth the benefit as you usually want your front-end code to be as small as possible.
Multiple streams
Please note that this feature is server-side only as in the browser we can only output to the console
The beauty of this logger is that it allows a custom stream where you can write the data to. So you can just log it all to a separate server, database and what not. But we don't just allow one stream we allow multiple streams so you might want to log to disk AND just output it in your terminal. The only thing you need to do is either use:
require('diagnostics').to([
  stream1,
  stream2
]);
To set multiple streams as the default streams or supply an array for the logger it self:
var debug = require('diagnostics')('example', { stream: [
  stream1,
  stream2
]});

debug('foo');
